|
About NMRPipe
|
NMRPipe is an extensive software system for processing, analyzing, and exploiting NMR spectroscopic data.
An NMRPipe installation
also provides the applications NMRDraw,
NMRWish, TALOS+, SPARTA+, DYNAMO, DC, MFR, ACME, and others.
NMRPipe is a UNIX-based system, and so it will require a familiarity of UNIX to
install and use the software. This means that an NMRPipe user
must be familiar with the UNIX command-line and environment,
and know how to create and edit UNIX shell-scripts using a text editor. This is true for
all versions of NMRPipe, including the Mac OS X and Windows XP Pro versions.
The following are GENERAL REQUIREMENTS for installing and using NMRPipe:
- Familiarity with UNIX.
- One of the supported UNIX systems: Linux (most PC versions are suitable),
Mac OS X, SGI Irix, Sparc Solaris, and Windows XP Pro with Microsoft Services for UNIX (SFU 3.5).
-
The system used for installation must be 32-bit compatible. This means that
64-bit systems must have 32-bit compatibility libraries installed as needed.
- A user account with C-shell (/bin/csh or /bin/tcsh) as the default shell.
- X11 Graphics server and the xterm terminal window.
- A three-button mouse or its equivalent.
|
How to get NMRPipe and Related Software
Download NMRPipe, related software, and demo data from the NMRPipe Installation Page:
https://spin.niddk.nih.gov/bax-apps/NMRPipe/install
Please note that because of current limitations in our software
development resources, we can generally no longer answer
questions or requests for help.
As an alternative, there is an unofficial mailing list for information
on use and features of NMRPipe ... you can join and post your own
questions and comments by going to the following web page:
http://groups.yahoo.com/subscribe.cgi/nmrpipe
Special Note for TALOS Users
There is now a Java Web-Based version of TALOS+ which
can be used directly without installing NMRPipe.
You can access this Web-based system, along with other facilities for
manipulating chemical shifts, dipolar couplings, and molecular
structures at the Bax Group NMR Server site:
https://spin.niddk.nih.gov/bax-apps/nmrserver
NMRPipe Citation Information
F. Delaglio, S. Grzesiek, G. W. Vuister, G. Zhu, J. Pfeifer and A. Bax:
NMRPipe: a multidimensional spectral processing system based on
UNIX pipes.
J. Biomol. NMR. 6, 277-293 (1995).
Documentation Links
Some Things NMRPipe and Related Software Can Do
Features listed here include the names of key scripts and demo data collections, many of
which contain special-purpose documentation for a particular application:
-
NMRPipe includes special tools to help automate the conversion
of time-domain data from Bruker, Varian, and JEOL Delta, with
adjustment for digital oversampling. This includes updates to
accommodate newer Bruker TopSpin format data. (bruk2pipe var2pipe
delta2pipe bruker varian delta).
-
General-purpose data format conversion tools are provided,
so that most any sequential data format can be used to generate
input for NMRPipe, and processed data can be saved in other
forms. (bin2pipe byteAdjust pipe2xyz conv.tcl txt2bin.tcl
txt2pipe.tcl pipe2txt.tcl).
-
NMRPipe includes comprehensive facilities to process, rephase and
display multidimensional data, including options for
Maximum Entropy Reconstruction (MEM), Linear Prediction (LP), and
Maximum Likelihood Frequency Maps (ML). Rigorous inverse processing
facilities are also provided for optimal use of these special
reconstruction methods. (nmrPipe nmrDraw, cbcanh.tar.Z sample3d.tar.Z etc).
-
The nmrDraw program can display multidimensional time- frequency-
and interferogram data, and multiple 1D overlays. The program also
provides real-time interactive phasing of multiple 1D spectra, with
automated reconstruction of imaginary data.
-
Recent versions of
nmrDraw now also include facilities for correlated cursors and
data positioning for viewing two or more related spectra.
-
NMRPipe's pipeline-based processing schemes are intrinsically
parallel, and multidimensional processing scripts can be easily
modified for distributed processing in multi-CPU environments
(nmrShell nmrCsh sample3d.tar.Z).
-
NMRPipe includes flexible, effective methods to replace bad values
in multidimensional data using Linear Prediction (badnoe.tar.Z).
-
NMRPipe provides a variety of approaches for reconstruction of Non-Uniform
Sampled Data (NUS), using MEM, Maximum Likelihood, and Matrix
Decomposition (nusdemo2d.tar.Z and nusdemo3d.tar.Z)
-
Rapid and Effective Automated Peak Detection for 1D-4D (nmrDraw nmrWish).
-
Extensive Line-Shape fitting functions, including direct
fitting of pseudo-3D data such as relaxation series or
J-modulated series (autoFit.tcl showEvolve.tcl fitXY.tcl
relax.tar.Z jmod.tar.Z).
-
Since many NMRPipe facilities use input and output in the
form of text tables, a variety of applications are available
to manipulate tables. There are applications to display tables, plot data
from tables, sort and adjust table values, select a subset of
entries according to a condition, and extract table values for use in
other scripts. PDB files can also be manipulated by many of these same
functions.
-
Create simulated time or frequency domain data, including
qualitative simulations of common spectral types such as "HNCA" etc
(autoFit.tcl simSpecND simTimeND sim3d.tar.Z).
-
Create and draw strip plots, projections, and overlays (scroll.tcl
stripPlot.tcl proj3D.tcl view2D.tcl). Latest options include
strip plots for multiple spectra, with drag and drop options to
adjust strip order (valpha.tar).
-
Predict protein backbone angles based on backbone chemical shifts
(talos.tcl) (See demo data in "talosplus/test" directory of installation).
-
Simulate and display protein backbone chemical shifts based on
backbone angles (See demo data in spartaplus/demo and mfr/demo).
-
Calculate J-couplings from Karplus parameters
(See directory "mfr/demo" in the installation).
-
Simulate or fit and display Dipolar Couplings
(See directories "dynamo/demos/dchn" "mfr/demo" in the installation).
-
Estimate protein alignment tensor parameters from measured
dipolar couplings without prior knowledge of the structure.
(See directory "mfr/demo" in the installation).
-
Visualize tensor parameters with respect to a PDB file.
(rotDC.tcl rotPCS.tcl and directory "mfr/demo" in the installation).
-
List or display Protein PDB backbone and sidechain angles,
visualize ramachandran trajectory for one or more proteins or
fragments (angles.tcl dynAngles.tcl scrollRamaCS.tcl directory mfr/demo,
directory dynamo/demos/ubiq).
Analyze Protein PDB for H-bonds and secondary structure and
turn classification (ss.tcl).
-
Find coordinate or torsion RMSD between two or more structures, form overlay
(ov.tcl, directory dynamo/demos/dcnh).
-
Simulated annealing structure calculation, including NOEs, J-coupling,
torsion restraints, radius of gyration, pseudo-contact shifts,
and dipolar couplings (directory "dynamo/demos").
-
Search the PDB Database for NMR Parameter Homology (directory mfr/demo).
NMRPipe is Available For:

Sun Sparc Solaris

SGI Irix 6.5 and Higher


RedHat Linux and Others (Intel)

Mac OS X 10.5.8 and Higher

Windows XP Pro with
Microsoft Services for UNIX
(SFU 3.5)
|
NMRPipe
Reference:
F. Delaglio, S. Grzesiek, G. W. Vuister, G. Zhu, J. Pfeifer and A. Bax:
NMRPipe: a multidimensional spectral processing system based on
UNIX pipes. J. Biomol. NMR. 6, 277-293 (1995).
NMRPipe provides comprehensive facilities for Fourier processing
of spectra in one to four dimensions, as well as a variety of facilities
for spectral display and analysis. It is currently
used in over 300 academic and commercial laboratories.
-
Complete multidimensional processing schemes can be constructed as
simple shell scripts, without the need to anticipate or explicitly
specify data sizes. The dimensions can be processed and re-processed
in any order, with the correct combination of real and imaginary data supplied
automatically.
-
Spectral axis calibrations are maintained during
all stages of processing, so that processing parameters can be specified
in terms of spectral units where desired.
-
Comprehensive implementation of complex linear prediction (LP) and
multi-dimensional
maximum entropy method (nD-MEM) for reconstruction of truncated data, as
well as complete and convenient inverse processing protocols required for
their use.
-
Convolution-based and polynomial solvent subtraction are provided, as well
as automated and manual baseline corrections.
-
Macro interpreter provides facilities for user-written processing functions
in a subset of C.
-
The pipeline approach is intrinsically parallel and automatically takes
advantage of multi-cpu configurations. In addition, explicitly parallel
schemes can also be constructed for balanced partitioning of processing
tasks.
-
Processed data can be used with well-known spectral analysis programs such
as:
NMRPipe also includes a variety of spectral format conversion
utilities:
-
Conversion facilities specifically for Varian and Bruker binary time-domain
data are provided, as well as general purpose facilities accommodating
most other formats. All data is converted to a common format with
a uniform organization of real and imaginary points.
-
The conversion commands can read or write data from a command pipeline
rather than a file, allowing such capabilities as conversion of compressed
data, conversion of input data dispersed over more than one file, and processing
schemes which go directly from spectrometer format to processed result.
-
Dedicated interactive Varian conversion interface reads the procpar file
and automatically extracts many acquisition parameters.
-
Dedicated interactive Bruker conversion interface reads and interprets
pulseprogram and acq files to deduce many acquisition parameters.
Full compensation for Bruker digital filter format is performed during
conversion.
-
All conversion facilities support special options for complex acquisition
schemes, including gradient-enhanced data (Rance-Kay/echo:anti-echo)
and accommodation for interleaved data formats.
Some other utilities provided with NMRPipe include:
-
Facilities to display and adjust NMRPipe-format file header information.
-
Multi-dimensional lineshape fitting utility, including time-domain, frequency-domain,
and hybrid models, and treatment of pseudo-3D data (e.g. relaxation
series or coupling evolution data).
-
Generation of peak evolutions from volume summation or Fourier-interpolated
intensity.
-
Facilities to simulate multidimensional time-domain and frequency-domain
data from peak tables.
-
Algebraic combination of spectra and FIDs.
-
General purpose least-squares fitting utility with user-defined functions
and Monte Carlo error analysis.
-
Summary statistics of data from spectra or text tables.
-
Principal Component Analysis (PCA)
|
|
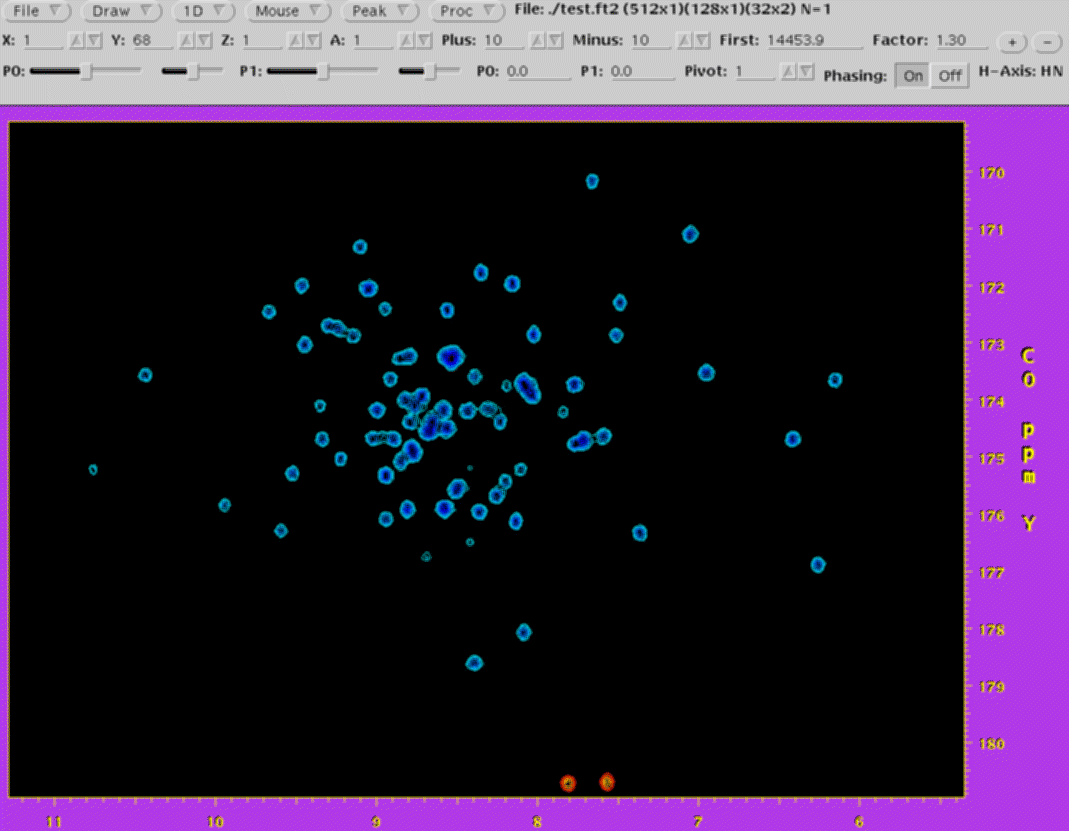
NMRDraw
NMRDraw is the companion graphical interface for NMRPipe and its
processing tools. Features of NMRDraw include:
-
Interactive interface for inspecting 1D-4D FIDs, interferograms, and spectra.
-
Real-time manipulation of one or more 1D vectors within the viewed data,
including pan, zoom, vertical scaling and offset, with 1D spectral graphics
overlaid on 2D contour display.
-
Real-time phasing of one or more vectors for any dimension, with imaginary
data reconstructed automatically as needed.
-
Facilities for interactive processing of individual vectors, and a script
editor for construction of processing schemes.
-
Interactive peak editing, with an interface to automated 1D-4D peak detection
via NMRWish.
|
|
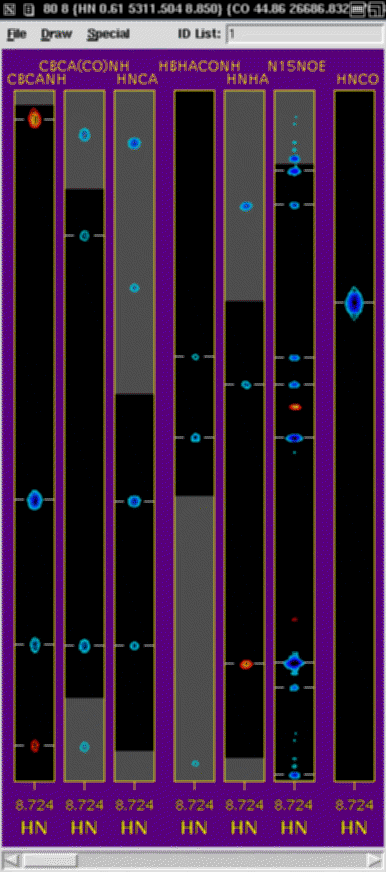
NMRWish
NMRWish is a custom version of Tcl/Tk for use with the NMRPipe System.
Tcl/Tk is a powerful and widely used command language which includes
facilities for graphical interface creation and for communication between
different applications; it was introduced to the NMR
community in the package NMRView
(Bruce Johnson, One Moon Scientific).
In addition to the usual features of Tcl/Tk, the
special facilities of NMRWish include the following:
-
Extraction or projection of arbitrary spectral Regions
of Interest (ROIs), with options for centering and alignment, as
well as automatic unfolding and sign-adjustment.
-
Automated peak detection in 1D-4D, including
options for identifying peaks due to random noise and
truncation artifacts.
-
Multi-window spectral graphics, with complete support of the usual Tk graphics
canvas facilities.
-
Scripts provide fully customizable PostScript output, including 1D and
2D extracts and projections, overlays, images, and strip plots.
-
A simple, general purpose database engine, capable
of manipulating peak tables, assignments, and PDB format molecular
coordinates.
-
General facilities for reading, writing, and
manipulating binary data, including type conversion, general
purpose vector processing, and access to NMRPipe processing functions.
|

|
DYNAMO
Additional Information:
https://spin.niddk.nih.gov/bax-apps/NMRPipe/dynamo
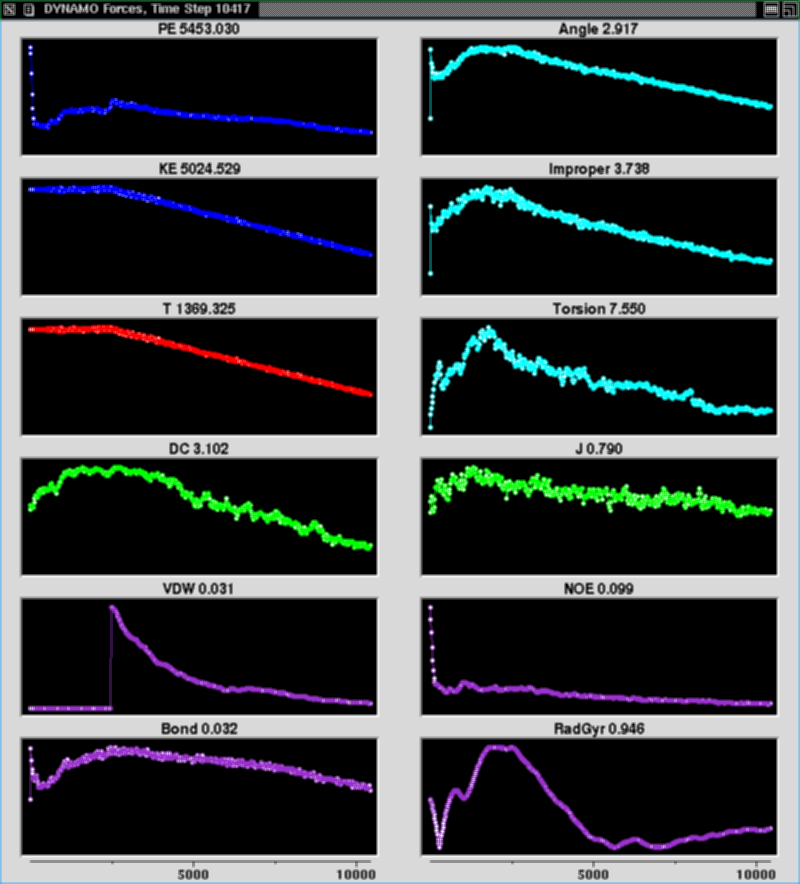
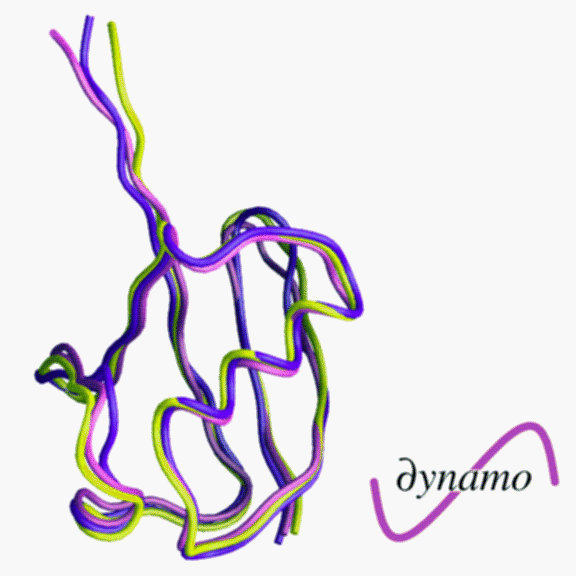
DYNAMO is a structure calculation and analysis system built as
an extension of our TCL/TK interpreter NMRWish, so that
analysis schemes and annealing protocols are TCL scripts,
and therefore relatively short, easy, and flexible.
DYNAMO includes a conventional cartesian coordinate simulated
annealing engine, which supports restraints including:
- NOE derived interproton distance restraints.
- NMR derived torsion angle restraints.
- 3J coupling constants.
- Relative and absolute coordinate restraints.
- Radius of gyration.
- Dipolar couplings.
- Pseudo-Contact shifts.
Structure calculation schemes provide for graphs of energy
terms during refinement, as well as display of the molecule
during annealing via Roger Sayle and E. James Milner-White's
well-known viewer RasMol.
In addition to simulated annealing structure calculation,
DYNAMO scripts can be used for applications such as:
- List Backbone or Sidechain Angles in a Given Structure
- Change Backbone or Sidechain Angles in a Given Structure
- NMR Structure Prediction Using Simulated Annealing: ubiquitin
- Compute RMS Between Two Structures
- Compute Average Structure
- Simulate Chemical Shifts Based on Secondary Structure
- Simulate Dipolar Couplings
- Measure Alignment Tensor Parameters via Known Secondary Structure Elements
- Homology Search Based on Chemical Shifts
- Homology Search Base on Dipolar Couplings
- Visualize NMR Parameters
|
|
MFR - Molecular Fragment Replacement
Reference:
F. Delaglio, G. Kontaxis, and A. Bax, Protein structure determination
using molecular fragment replacement and NMR dipolar couplings,
J. Am. Chem. Soc. 122, 2142-2143 (2000).
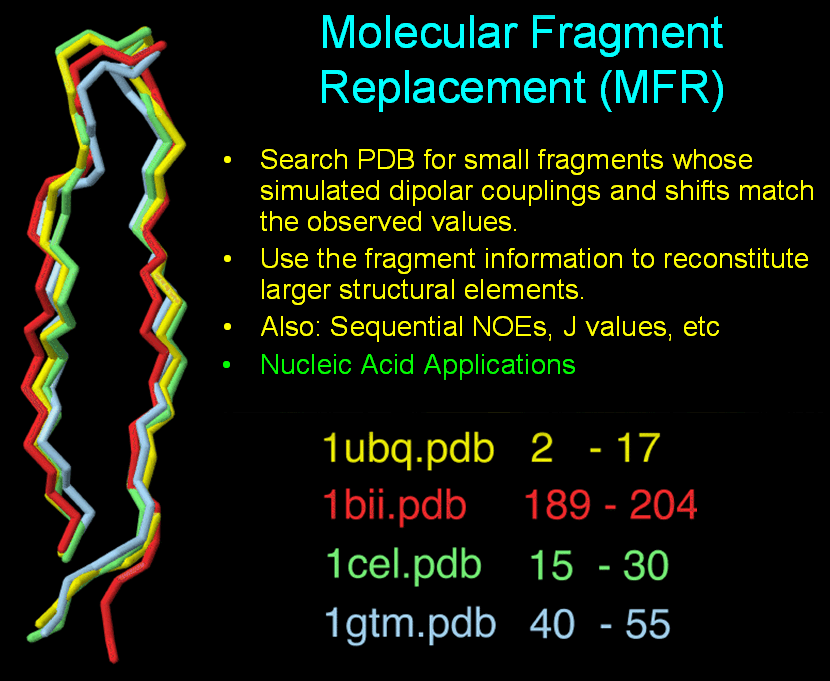
The MFR method determines elements of protein structure by finding
small fragments (5-15 residues) in the PDB database whose simulated
dipolar couplings or backbone chemical shifts match those measured for
the target
protein. These small homologous fragments can then be used in various ways
to reconstitute larger elements of protein structure.
|


|
TALOS+
Contact:
shenyang@niddk.nih.gov
bax@nih.gov
References:
TALOS+: A hybrid
method for predicting protein backbone torsion angles from NMR chemical
shifts
Yang Shen, Frank Delaglio, Gabriel Cornilescu, and Ad Bax
J. Biomol. NMR,
44 213-223 (2009).
Protein backbone angle restraints from searching a database for chemical shift
and sequence homology.
Gabriel Cornilescu, Frank Delaglio, and Ad Bax
J. Biomol. NMR,
13 289-302 (1999).
Special Note: The original version of TALOS has been replaced
by an improved version called TALOS+.
This improved version is operated
in much the same way as the original versions.
TALOS+ was developed
by Dr. Shen Yang in the
Ad Bax group, and is now installed as an optional part
of NMRPipe.
TALOS+ is a hybrid system for
empirical prediction of protein phi and psi backbone torsion angles
using chemical shifts and sequence.
TALOS+ is an enhanced version of the earlier TALOS system
which improves upon the original TALOS database mining
approach by including a neural network classification
scheme. This improved method provides a larger number of useful backbone
angle predictions, 88% of residues in a given protein on average.
The original TALOS approach is an extension of the well-known observation
that many kinds of secondary chemical shifts (i.e. differences between
chemical shifts and their corresponding random coil values) are highly
correlated with aspects of protein secondary structure. The goal of
TALOS+ is to use secondary shift and sequence information in order to
make quantitative predictions for the protein backbone angles phi and psi,
and to provide a measure of the uncertainties in these predictions.
In practice, TALOS+ searches a database
for the 10 best matches to the secondary chemical shifts of given
residue and its two flanking neighbors (a residue triplet).
The chemical shifts are also evaluated by an
artificial neural network, which classifies secondary structure.
These results are combined to determine whether the best database
matches for a given residue have sufficient consensus to make a useful
backbone angle prediction. The classification and backbone angle
predictions can be viewed interactively through the RAMA+ graphical
interface which is part of the TALOS+ system.
|

|
ACME
Reference:
Frank Delaglio, Zhengrong Wu and Ad Bax:
Measurement of Homonuclear Proton Couplings from Regular 2D COSY Spectra
J. Magn. Reson., 149, 276-281 (2001).
Additional Information:
https://spin.niddk.nih.gov/bax-apps/NMRPipe/acme
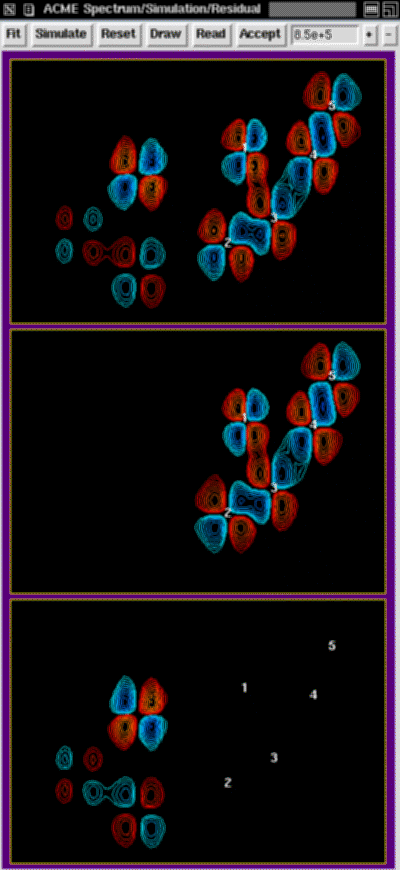
ACME is an interactive interface for measuring coupling constants from
cross peaks in regular 2D COSY spectra. ACME is built from tools in the
NMRPipe System.
The main idea behind ACME is that active couplings can be extracted accurately
from individual COSY multiplets if the amplitude of the multiplet
is known and held fixed during a fitting procedure. If the spin systems
in the sample are fully relaxed, the amplitude will be uniform for all
cross peaks, and it can be measured readily from one or more diagonal peaks.
So, in practice, use of ACME will involve the following steps:
-
Measure COSY spectrum with conditions that allow the spin systems to
be fully relaxed at the start of the COSY sequence.
-
A numerical diagonal processing scheme is used to prepare two versions
of the COSY spectrum:
-
One version will contain the diagonal signals
only, phased in absorptive mode. This version of the spectrum will be
used to measure the amplitude.
-
The other version will contain the cross peaks only, with the
diagonal numerically subtracted. This version will be used to measure
active couplings in the cross peaks.
-
The ACME program will first be used in diagonal mode to fit one
or more peaks in the diagonal-only spectrum. Fitting more than
one diagonal peak will help establish average amplitude as well
as its uncertainty.
-
Using the amplitude value determined from the diagonal, the ACME
program will be used to measured the couplings in the cross peak
spectrum:
-
Select a region to analyze from the spectrum
-
Insert signals at the approximate center of each multiplet
of interest.
-
Specify the desired numbers of passive couplings
for each multiplet.
-
Perform the fitting procedure, and inspect the results.
|
* All documents in PDF format require the
free Adobe Acrobat Reader application for viewing
[ Home ]
[ NIH ]
[ NIDDK ]
[ Terms of Use ]
last update: Apr 26 2016 / big fd
|


